

Read Your First Campaign Results in FoxReach (1 min)
Step 1: Start on the Dashboard
Click Dashboard at the top of the sidebar. This is the morning check: how much has gone out, how many people replied, what share of sends that is, and what is still running. The four cards across the top are:- Emails Sent, the total across every campaign in the workspace, with a smaller “today” line underneath while campaigns are active.
- Replies, the total real replies, with a “recent” count taken from the activity feed below.
- Reply Rate, replies divided by sends, with the fraction shown underneath so you can see the sample size behind the percentage.
- Active Campaigns, with the total number of campaigns beside it.
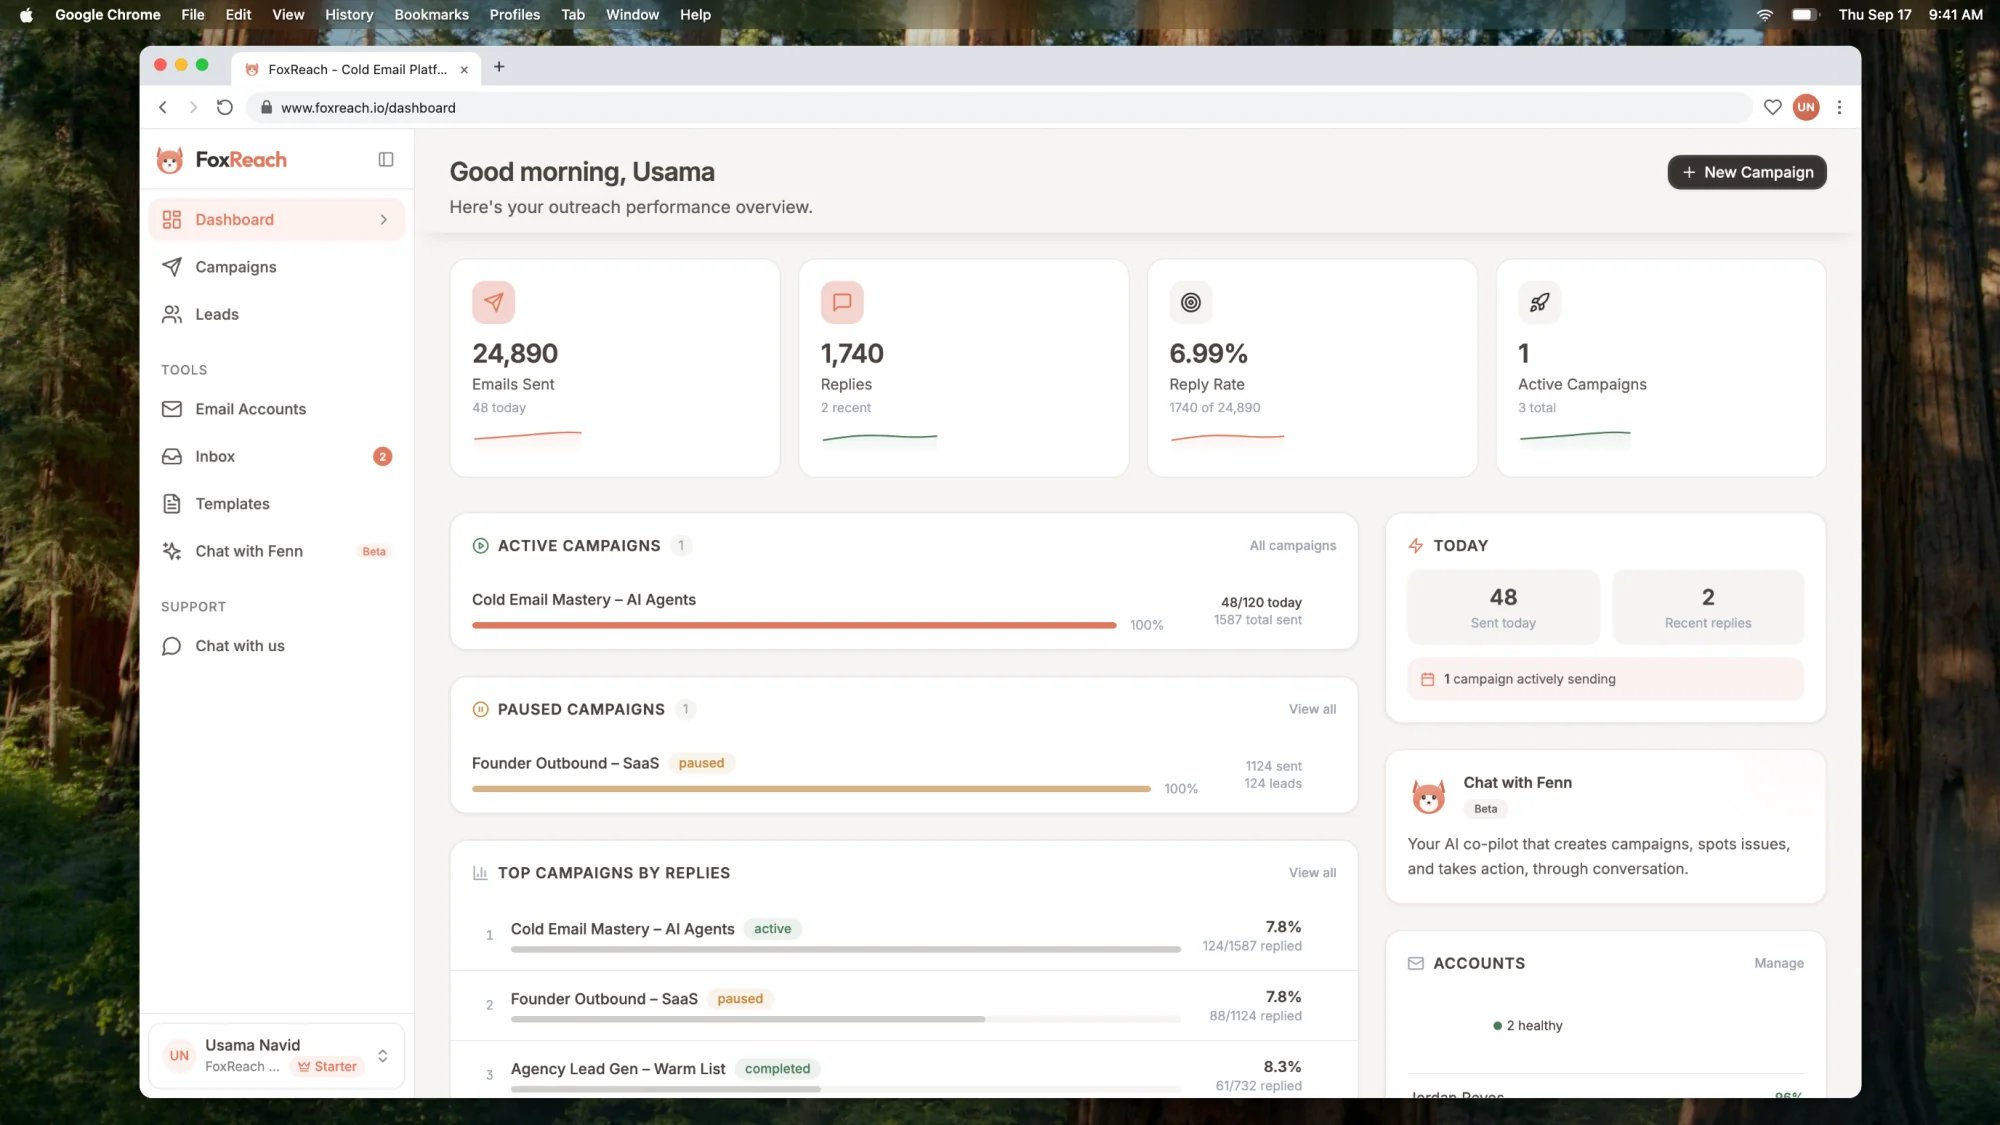
The FoxReach Dashboard showing Emails Sent, Replies, Reply Rate and Active Campaigns, the Top Campaigns by Replies leaderboard and the Recent Activity feed
Step 2: Open the campaign overview
Click Campaigns in the sidebar, then click the campaign name. In the demo workspace that is “Cold Email Mastery - AI Agents”. You land on the Overview tab, which is the full picture for one campaign. The stat cards at the top show Total Leads, Emails Sent and Replies. The fourth card changes with the situation: it shows Bounced once the campaign has any bounces, Open Rate if open tracking is on, and Reply Rate otherwise. In the demo the campaign has 124 leads, 1,587 emails sent, 124 replies and 18 bounces.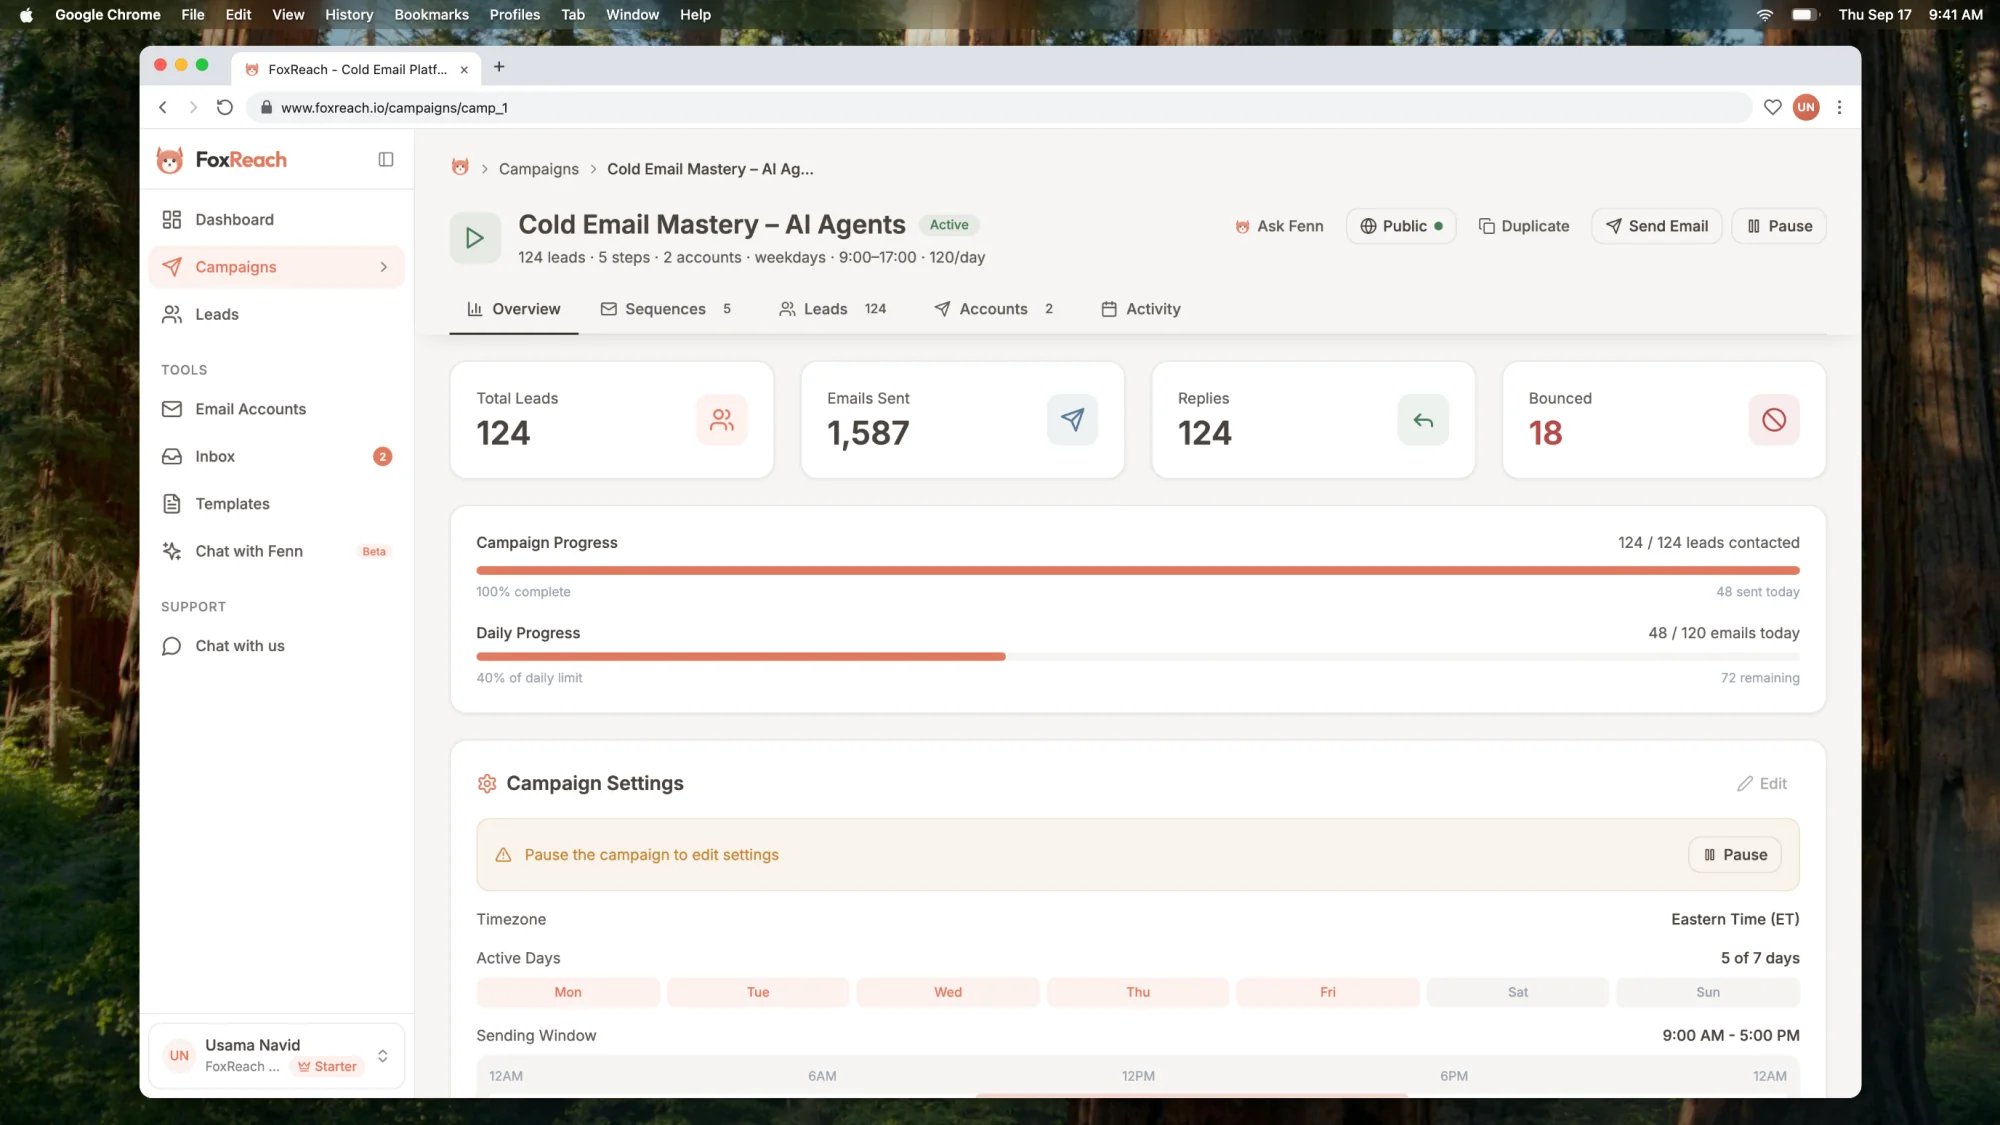
A campaign's Overview tab with Total Leads, Emails Sent, Replies and Bounced, plus Campaign Progress and Daily Progress bars
Step 3: Trace individual events in the Activity tab
Click the Activity tab. Where the Overview tab gives totals, Activity lists every event with the step and the account that produced it. The table columns are Type, Contact, Subject, Step, Details, Account and Time.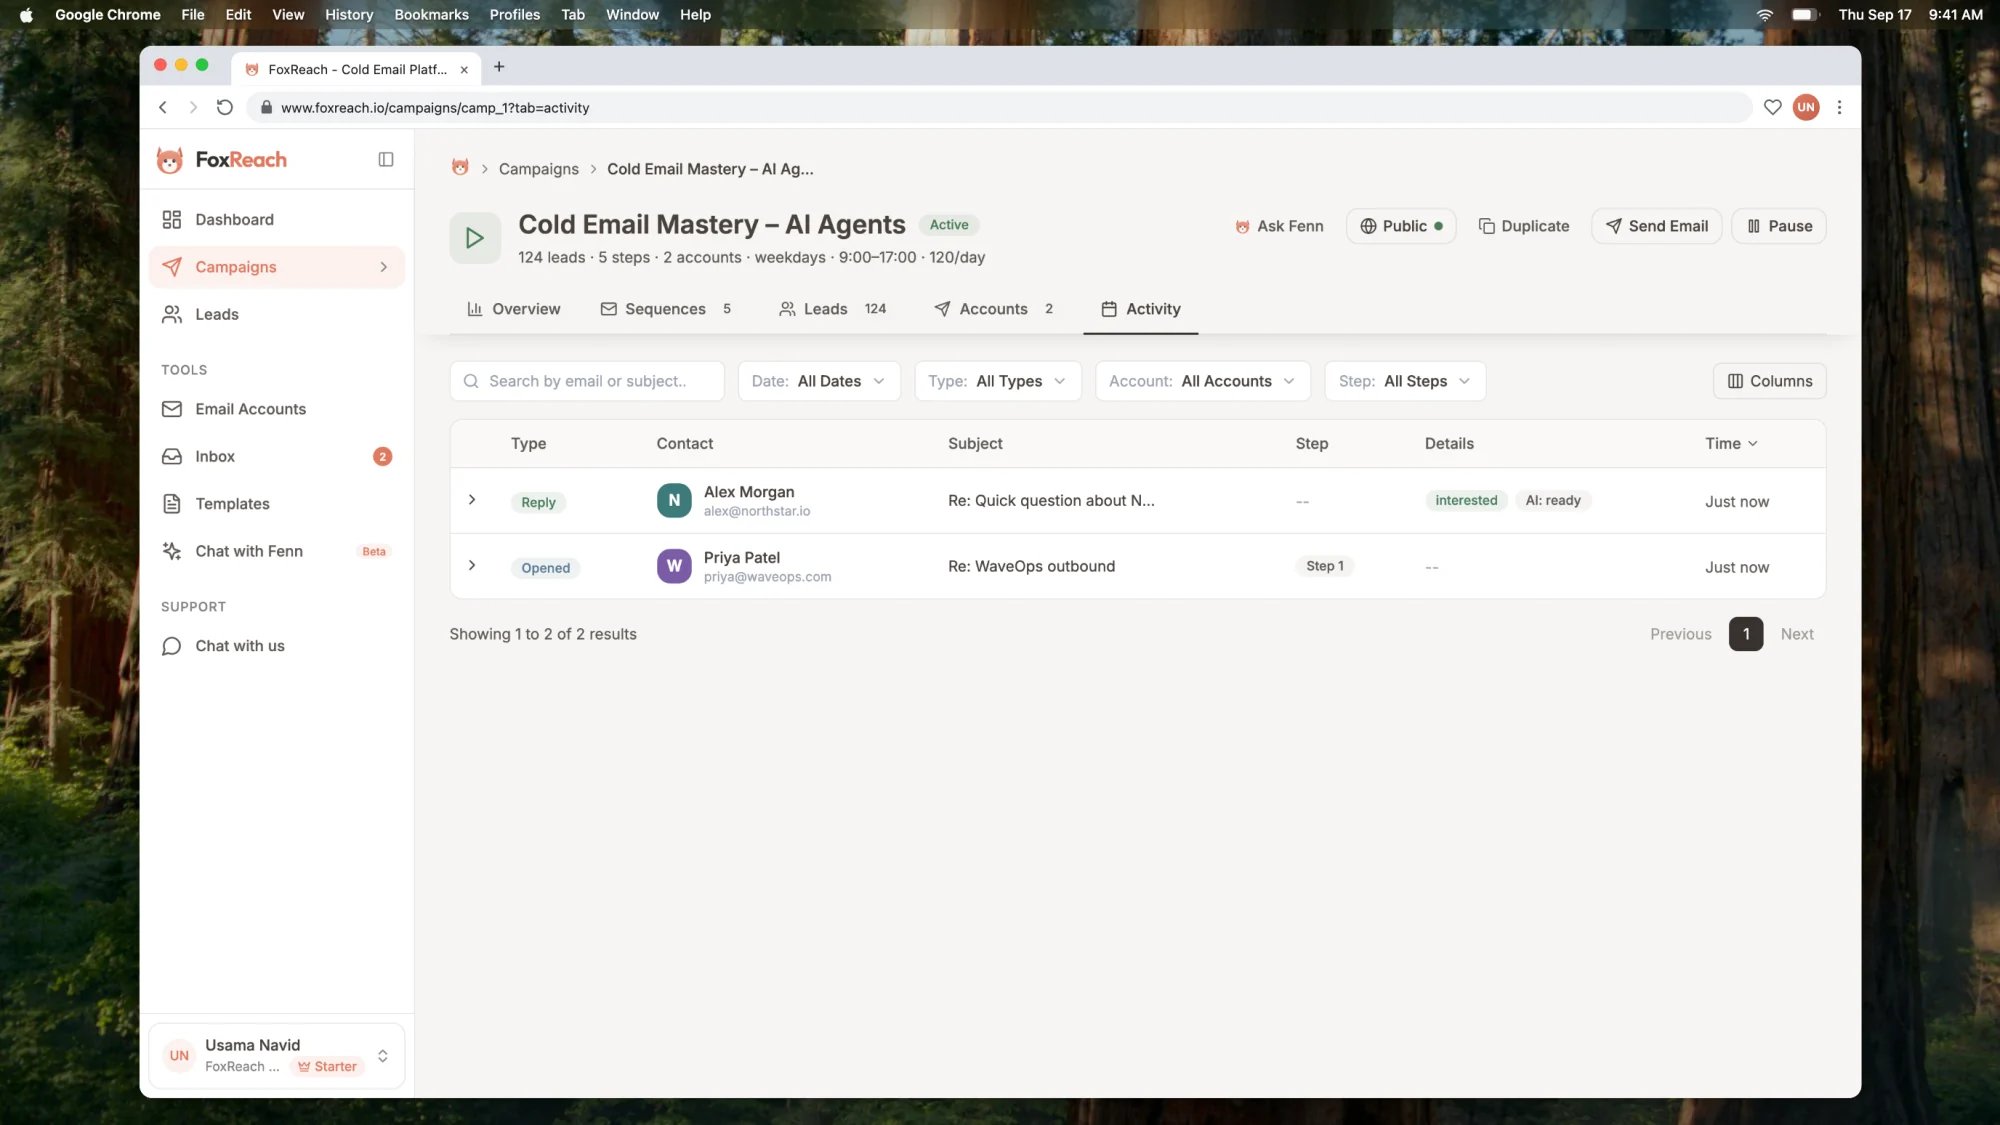
The campaign Activity tab listing sent, opened and replied events with the step number and the sending account for each
- Type narrows to Sent, Opened, Replied, Bounced, Clicked or Failed.
- Step narrows to one step of the sequence, which is how you get per-step numbers for a step that has no A/B test.
- Account narrows to one sending inbox, which is how you find out whether one mailbox is producing all the bounces.
- Date narrows to a single day with activity.
Step 4: Check per-step and variant performance
Click the Sequences tab. Each step is a card with its subject line and, from step two onward, the delay after the previous step. If a step has an A/B test, expand it and look for Variant Performance. It is a table with a row per variant and columns for Sent, Opened, Open%, Replied and Reply%. FoxReach highlights the variant with the best reply rate but leaves the decision to you. The A/B testing tutorial covers how to set the test up, how large a sample to wait for, and how to promote the winner. For a step without variants, use the Activity tab’s Step filter from the previous section to count sends and replies for that step.Step 5: Share a read-only report
At the top of the campaign page, click Share. The Share Campaign dialog opens, generates a public link, and shows it under Share Link. Click Copy Link to put it on your clipboard, or open it in a new tab to see what the recipient sees.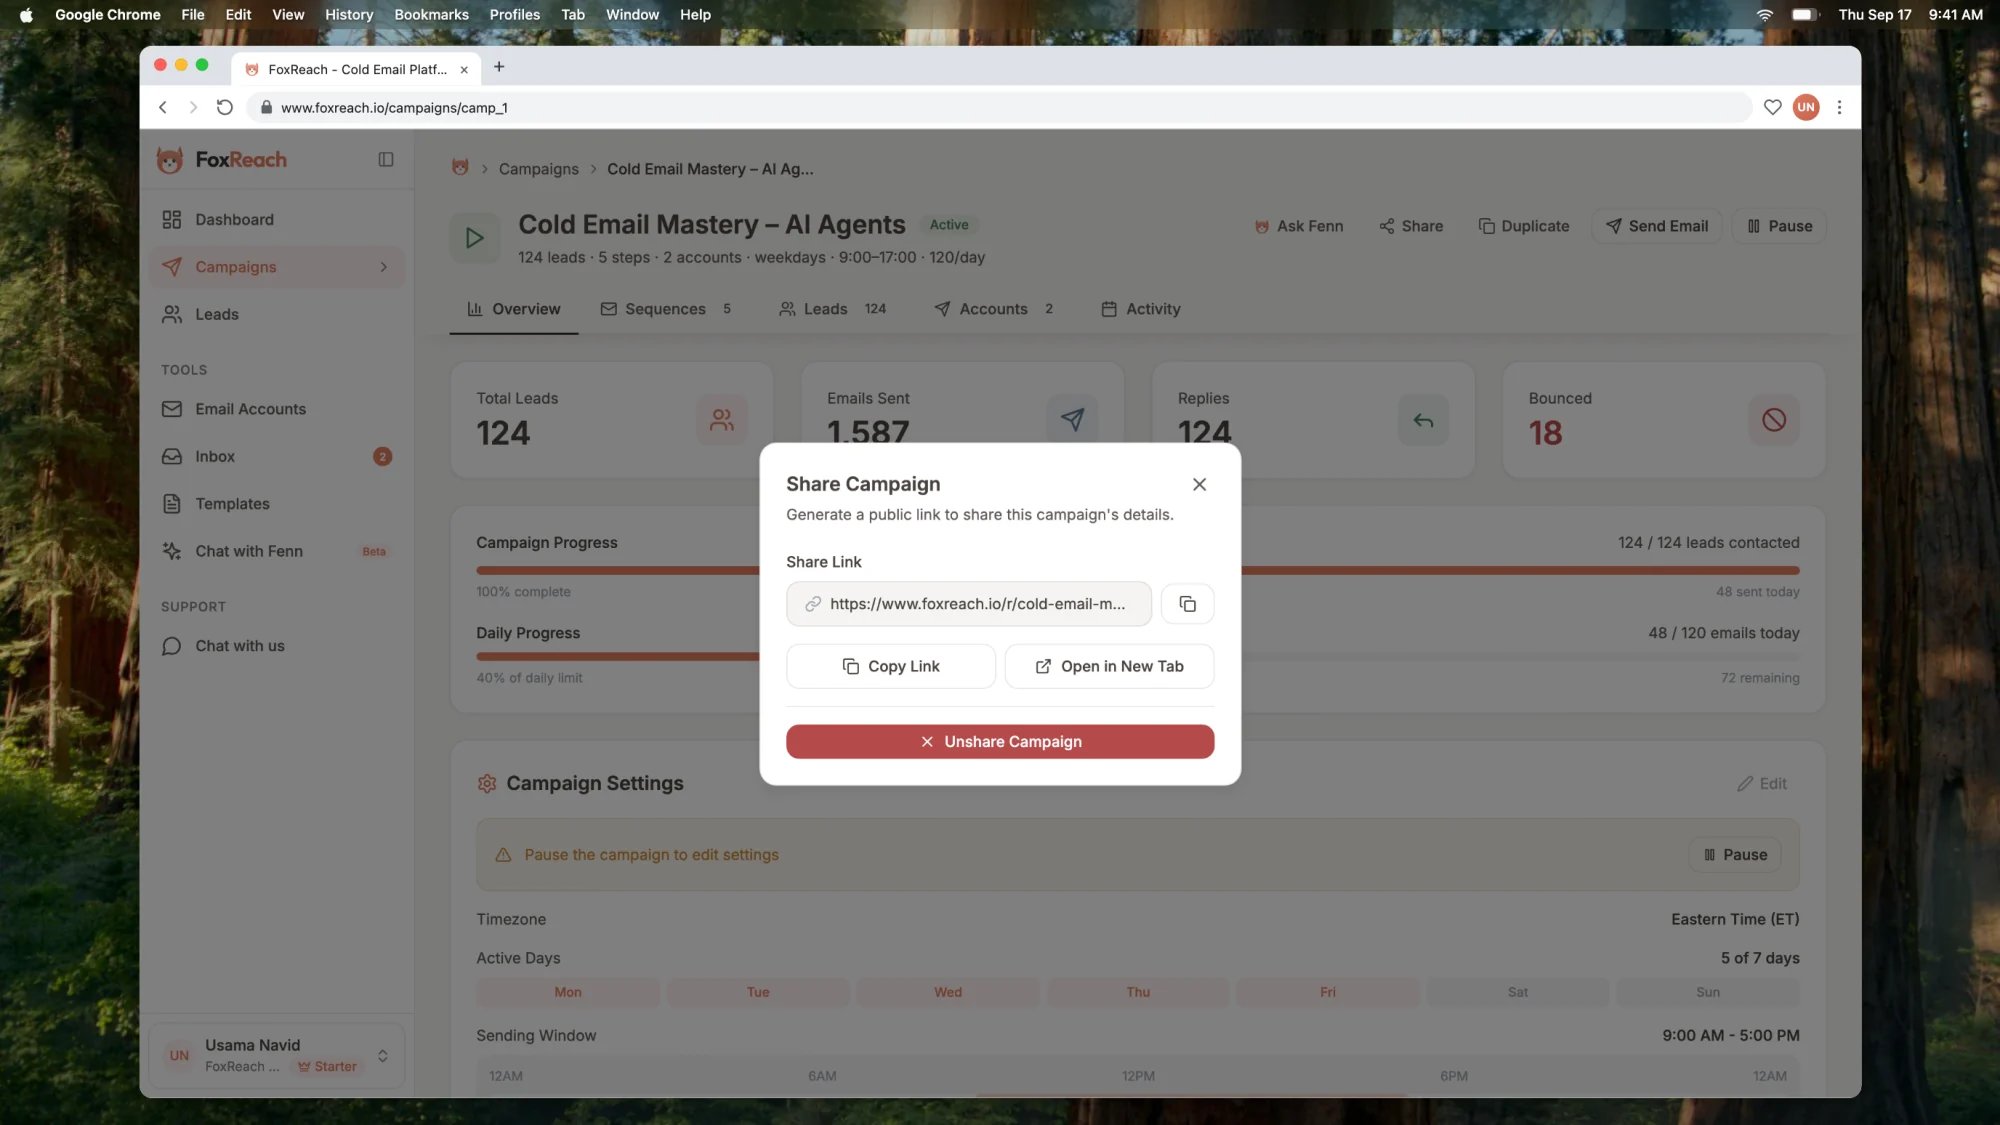
The Share Campaign dialog with the generated public report link, Copy Link and Unshare Campaign buttons
What the numbers mean
Every count on the Overview and the dashboard comes from one of a few sources, and knowing which explains most apparent contradictions.When to act
Bounce rate. Divide Bounced by Emails Sent on the Overview tab. As a rule of thumb, above two to three percent on a verified list means the list is stale or verification was skipped, and above five percent you should pause and fix the list before sending more. Bounces feed straight into the health score of the inbox that sent them, so a bad list damages the mailbox, not just the campaign. Google’s email sender guidelines set a separate threshold for spam complaints, which must stay below 0.3 percent and ideally under 0.1 percent; both measures climb on the same bad lists. The deliverability guide covers what to change. Reply rate. As a rule of thumb, cold email reply rates mostly fall between two and ten percent, and a campaign above five percent is doing well. Below two percent after a few hundred sends, the problem is usually targeting or copy rather than infrastructure, provided bounces are low. Use the Activity tab’s category badges before deciding: a four percent reply rate that is mostly opt-outs is a different problem from one that is mostly meetings. A falling health score. Each inbox’s score is recalculated daily from the last seven days: bounces pull it down hard, replies nudge it up a little, and a broken connection costs it 20 points. If a score drops below 70 and has fallen by ten points or more, FoxReach emails you an alert. Open the Activity tab, filter Type to Bounced and Account to that inbox, and find the campaign and leads behind it. Pausing that campaign for a day while the score recovers is cheaper than losing the mailbox.Troubleshooting
The stats look stale. Campaign totals for sent, replied and bounced are recomputed every 15 minutes. If you just watched a reply land in the Activity tab, give the Overview cards a quarter of an hour. Sent Today and the Activity feed are live. Opens are missing or zero. Check the Open Tracking row on the Overview tab. It is off by default, and you turn it on from Edit. Even when it is on, step one never carries a pixel, and plain-text follow-ups do not either. A single-step campaign will always read zero opens, and that is correct behaviour. Replies are lower than what I see in the inbox. The Replies counter deliberately excludes bounce notices, warmup exchanges and unrelated inbound mail. Open the unified inbox and filter by category to see the full set, including the ones that were filtered out of the count. The shared report is not loading. A “Report Not Found” page means the campaign has been unshared, or the link came from an older share since revoked. Open the campaign, click Share, and copy the current link from the Share Campaign dialog. Re-sharing creates a new link, so any old one stays dead. Dashboard Reply Rate and campaign Reply Rate disagree. The dashboard sums every campaign in the workspace, including completed and paused ones, so a strong old campaign can mask a weak new one. Judge one campaign on its own Overview tab.Next step
Once you can read the numbers, improve them. Split a step into variants and let the Variant Performance table decide which subject line earns more replies. Then work the replies in the unified inbox, where every interested reply from the Activity feed is waiting with an AI-drafted response. If you want these numbers somewhere other than the FoxReach screen, the same overview and per-campaign counters are exposed on the public API for any key with read scope; the API keys and webhooks tutorial shows the calls. AI agents can query them through the FoxReach MCP server, and the integrations directory lists the automation tools that can pull them into a sheet or a CRM on a schedule.Frequently asked questions
How often do campaign results update in FoxReach?
How often do campaign results update in FoxReach?
Why does my campaign show zero opens?
Why does my campaign show zero opens?
What is a good reply rate for cold email?
What is a good reply rate for cold email?
Can I pull FoxReach campaign stats into a spreadsheet or another tool?
Can I pull FoxReach campaign stats into a spreadsheet or another tool?